CASE STUDY: ANONYMISED CLIENT DATA
Organic growth, shown in the data.
Real Google Search Console and Google Analytics 4 figures from a London luxury transport company. The client is anonymised and shared with their permission.
From no revenue to over £50,000.
Revenue is reported by the client. It is not tracked in the Analytics data shown on this page.
revenue from the website in 2025
before the site had search visibilityrevenue from the website in 2026
client-reported, to October 2026In 2025 the website produced no revenue. In 2026 it has produced more than £50,000. The client reports that no paid advertising, partnerships or sponsorships contributed to it. The charts and tables below show the search visibility behind that change.
The results at a glance.
Search Console covers 4 June 2025 to 3 October 2026. Analytics covers 5 October 2025 to 4 October 2026.
clicks from Google search
Search Console, 16 monthsimpressions in Google search
Search Console, 16 monthsaverage position across all queries
Search Console, 16 monthsof website sessions came from organic search
Analytics, 12 monthsSearch traffic, month after month.
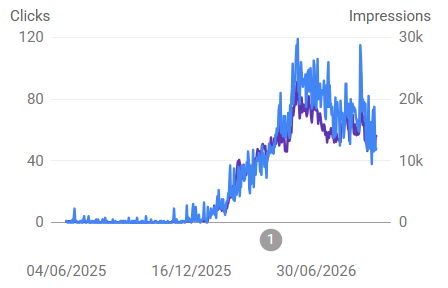
This is the client's Google Search Console performance report for web search. We cropped it to remove the client's identity. The chart itself is unedited.
What we can see
- Search traffic was close to zero until late 2025, then rose steadily through the first half of 2026.
- Daily clicks peaked at roughly 120. Since the peak, traffic has settled lower but is still far above where it started.
- Clicks and impressions rise together. That points to broader visibility in Google, not a few one-off spikes.
- An average position of 9.2 means the site's pages typically appear around the bottom of page one.
Where the visits came from.
Google Analytics 4, traffic acquisition report: sessions by default channel group, 5 October 2025 to 4 October 2026. Figures are as reported by GA4. Smaller channels (unassigned, social and paid) are not shown.
| Channel | Sessions | Share of sessions | Engagement rate | Key event rate |
|---|---|---|---|---|
| Organic Search | 7,298 | 62.6% | 63.4% | 19.2% |
| Direct | 3,948 | 33.9% | 27.5% | 10.2% |
| AI Assistant | 185 | 1.6% | 67.6% | 38.9% |
| Referral | 148 | 1.3% | 52.7% | 24.3% |
| All channels | 11,661 | 100% | 50.1% | 16.8% |
What we can see
- Organic search is the biggest source of visits at 62.6% of sessions. It is also the best-engaged large channel, at 63.4% engagement against 27.5% for direct traffic.
- Organic visitors complete a tracked action (a GA4 key event) in 19.2% of sessions, almost double the rate for direct visitors.
- AI assistants such as ChatGPT sent only 185 sessions, but those visitors had the highest key event rate of any channel at 38.9%. The sample is small, so treat it as a direction rather than a rule. It does suggest AI referrals are early but high-intent.
What customers say.
The client's Google Business Profile has a 4.9 rating from 49 reviews. At least two reviewers say they found or booked the company through AI. Names are removed and the company's name is replaced with [the company].
"Excellent booking service, we used Chat GPT as we were in a hurry just as we're leaving SFO. And GPT did all the booking process except payment where I took over."
"… I came across [the company] via AI. [The company]'s service from initial contact, through to ease of booking, payment … was 5 star all the way!"
These reviews fit the Analytics data above, where AI assistants sent a small number of visitors who engaged more and took more tracked actions than any other channel. Google notes that reviews are not verified.
How to read this case study.
- This is one client. Results depend on the market, the competition and where a site starts, so yours will differ.
- All figures come from Google Search Console and Google Analytics 4 and are shown as reported. They have not been independently audited.
- The revenue figure comes from the client. The Analytics data on this page is not set up to track revenue, so it cannot be checked against it. Analytics does show organic search as the largest source of visits, at 62.6% of sessions.
- Much of the impression volume comes from broad informational searches, so the click-through rate is low at 0.5%. Impressions measure visibility, not demand.
- Search traffic is also affected by seasonality and Google updates, not only by SEO work.
Our monthly client reports are built from the same Search Console and Analytics data. You can see the pricing for each plan on our pricing page, or start with a £249 Visibility Audit.
More case studies.
UK accident support company
Average Google position improved from 61 to 28 in 16 months, and organic search drove about 85% of tracked conversions.
New UK home renovation site
Early results: 23 pages indexed and 15.3k impressions in the first five weeks. Too early to judge, reported as it stands.