CASE STUDY: ANONYMISED CLIENT
From page two to page one, for a luxury London chauffeur company.
How we rebuilt the SEO of a luxury London chauffeur company’s website, with real Google Search Console and Analytics figures. The client is anonymised and shared with their permission.
The results at a glance.
Search Console compares January 2026 with June 2026. Booking page views come from Google Analytics 4 and compare January with July 2026.
more clicks from Google search
200 to 2,767 a month, Jan to Jun 2026more impressions in Google search
39,052 to 565,855 a month, Jan to Jun 2026average position in Google
page two to page one, Jan to Jun 2026more views of the booking page
49 to 466 a month, Jan to Jul 2026Work began in 2025, so January 2026 is a baseline taken after the first foundation work, not a before-we-started figure. The growth below is measured from there.
From one booking a month to 42.
Bookings and revenue come from the client’s online store records. They are not tracked in the Analytics data shown on this page.
online bookings a month
January to July 2026net website revenue a month
January to July 2026Website revenue for 2026 to October is over £50,000. The client ran no paid advertising. Analytics shows a handful of sessions labelled as paid search because of attribution errors.
Clicks from Google, month by month.
Monthly clicks from Google web search, January to July 2026, from the client’s Search Console data.
What we can see
- Clicks rose every month from January to June, from 200 to 2,767. July came in at 2,477.
- Organic visits in Analytics rose from 113 a month in January to 1,250 in June, so the extra clicks turned into real sessions on the site.
- Average position moved from 20.2 to 8.8 over the same period. That is the move from the bottom of page two to the bottom of page one.
The longer view, day by day.
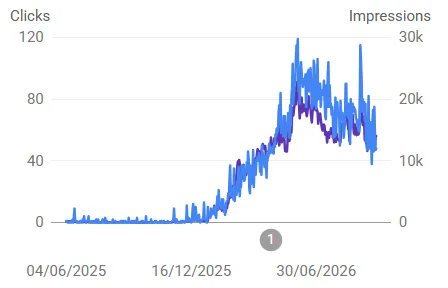
This is the client's Google Search Console performance report for web search. We cropped it to remove the client's identity. The chart itself is unedited.
What we can see
- Search traffic was close to zero until late 2025, then rose steadily through the first half of 2026.
- Daily clicks peaked at roughly 120. Since the peak, traffic has settled lower but is still far above where it started.
- Across the whole 16 months the site had 15.1k clicks and 3.27m impressions, at an average position of 9.2.
Where the site started.
The service was premium. The website did not sell it. When we began, this is what we found.
- On page two of Google, with about 200 clicks a month in January 2026.
- Only two of London’s five main airports had route pages at all.
- The footer, on every page, linked visitors to other companies’ websites and not once to booking.
- Published prices did not always match what the booking system charged.
- Google was flagging structured data errors, and old addresses were serving duplicate copies of the homepage.
- No reliable way to tell which pages led to bookings.
What we did.
Work ran from 2025 to October 2026. The dates below are when each piece went live.
Rebuilt the foundations
Audited every URL on the site. Removed duplicate homepage copies, built more than 600 redirect rules to clear a 1,846-row error log, rewrote 445 internal links so none send visitors to a dead end, and rebuilt structured data (Google’s errors went from 8 to 0, checked 29 July and 17 August 2026). Indexed pages rose from 485 to 696 in 13 days.
A five-airport route network
Built and rebuilt around 630 route landing pages across five London airports, each one checked against the client’s own booking system and linked into a planned internal linking map. The London City section, 79 pages, went from research to live in about ten days (August 2026).
Homepage and airport hubs
Rebuilt the homepage (live 3 August 2026) and the airport hub pages, with the booking engine at the top of each page, keyword-led titles and a clear path to book. Replaced a footer that linked to other websites with 31 internal links and a booking button.
Guides and content for Google and AI
Rewrote the blog around what converts, rebuilt six airport flight information pages and wrote new service pages, comparison pages and guides, built to be quoted in Google’s AI Overviews and by assistants such as ChatGPT. Facts were checked against primary sources before publishing.
Accuracy, local search and trust
Fact-checked 693 pages in September 2026 and corrected about 175 of them. Rebuilt the Google Business Profile (29 July 2026): description, categories, service area and services. Google now shows “Provides: Luxury Airport Transfers”.
Checkout, tracking and speed
Protected the payment flow so site updates cannot break it, rebuilt analytics to measure real bookings and AI assistant traffic, and passed Core Web Vitals on real-user data (12 September 2026). One consistent design system now runs across the site.
More results.
Figures are from Search Console unless stated. Each result has a date.
| Result | Figure | Date |
|---|---|---|
| Organic sessions a month (Analytics) | 113 to 1,250 | January to June 2026 |
| Google ranking for “luxury airport transfer heathrow” | Position 1 | 2026, after the homepage rebuild of 3 August |
| Google AI Overview | Site cited and named first for a route search, with the same page ranking second | 2026 |
| Rebuilt long-distance comparison pages | Position 3 and 5 for two Cotswolds searches within days of publishing | September 2026 |
| Five new London City guides | All on page one in 11 days, with 31 clicks and 3,260 impressions | 20 to 30 September 2026 |
| Rebuilt Stansted flight page | Weekly clicks 31 to 150 | Week of 6 to 12 September 2026 |
| Google review errors | 8 to 0 | 29 July to 17 August 2026 |
| Internal links to a missing page | 0 | September 2026 |
- Some of the highest-impression pages on the site today are guides and flight pages that we built or rebuilt. In the three months to 15 September 2026 the biggest three each had more than 130,000 impressions.
- The five London City guides earned more clicks in their first 11 days than all 76 London City route pages combined, which shows how much demand sits in informational searches.
Where the visits came from.
Google Analytics 4, traffic acquisition report: sessions by default channel group, 5 October 2025 to 4 October 2026. Figures are as reported by GA4. Smaller channels (unassigned, social and paid) are not shown.
| Channel | Sessions | Share of sessions | Engagement rate | Key event rate |
|---|---|---|---|---|
| Organic Search | 7,298 | 62.6% | 63.4% | 19.2% |
| Direct | 3,948 | 33.9% | 27.5% | 10.2% |
| AI Assistant | 185 | 1.6% | 67.6% | 38.9% |
| Referral | 148 | 1.3% | 52.7% | 24.3% |
| All channels | 11,661 | 100% | 50.1% | 16.8% |
What we can see
- Organic search is the biggest source of visits at 62.6% of sessions. It is also the best-engaged large channel, at 63.4% engagement against 27.5% for direct traffic.
- Organic visitors complete a tracked action (a GA4 key event) in 19.2% of sessions, almost double the rate for direct visitors.
- AI assistants such as ChatGPT sent only 185 sessions, but those visitors had the highest key event rate of any channel at 38.9%. The sample is small, so treat it as a direction rather than a rule. It does suggest AI referrals are early but high-intent.
What customers say.
The client's Google Business Profile has a 4.9 rating from 49 reviews. At least two reviewers say they found or booked the company through AI. Names are removed and the company's name is replaced with [the company].
"Excellent booking service, we used Chat GPT as we were in a hurry just as we're leaving SFO. And GPT did all the booking process except payment where I took over."
"… I came across [the company] via AI. [The company]'s service from initial contact, through to ease of booking, payment … was 5 star all the way!"
These reviews fit the Analytics data above, where AI assistants sent a small number of visitors who engaged more and took more tracked actions than any other channel. Google notes that reviews are not verified.
How to read this case study.
- This is one client. Results depend on the market, the competition and where a site starts, so yours will differ.
- All figures come from Google Search Console and Google Analytics 4 and are shown as reported. They have not been independently audited.
- Work began in 2025. January 2026 is a comparison point partway through the engagement, not a pre-engagement baseline.
- Bookings and revenue come from the client’s online store records. The Analytics data shown here was not set up to track revenue, so the two cannot be cross-checked.
- Much of the impression volume comes from broad informational searches, so the overall click-through rate is low at 0.5%. Impressions measure visibility, not demand.
- Search traffic is also affected by seasonality and Google updates, not only by SEO work.
Our monthly client reports are built from the same Search Console and Analytics data. You can see the pricing for each plan on our pricing page, or start with a £249 Visibility Audit.
More case studies.
Regulated UK service company
Position 6 to 1 for a core search in seven weeks, and 32 pages rewritten in two weeks.
New UK home improvement site
A 21-page, 38,000-word guide site built from scratch in three weeks. Early results, reported as they stand.